Charts & Graphs
What results when a spreadsheet is brought along on Tour
Here is a set of essentially irrelevant information from the Tour, presented in mildly appealing graphical representions.
Note: Most of the graphs are very large images. Scroll horizontally to see the whole graph, and undo any browser auto-resize changes.
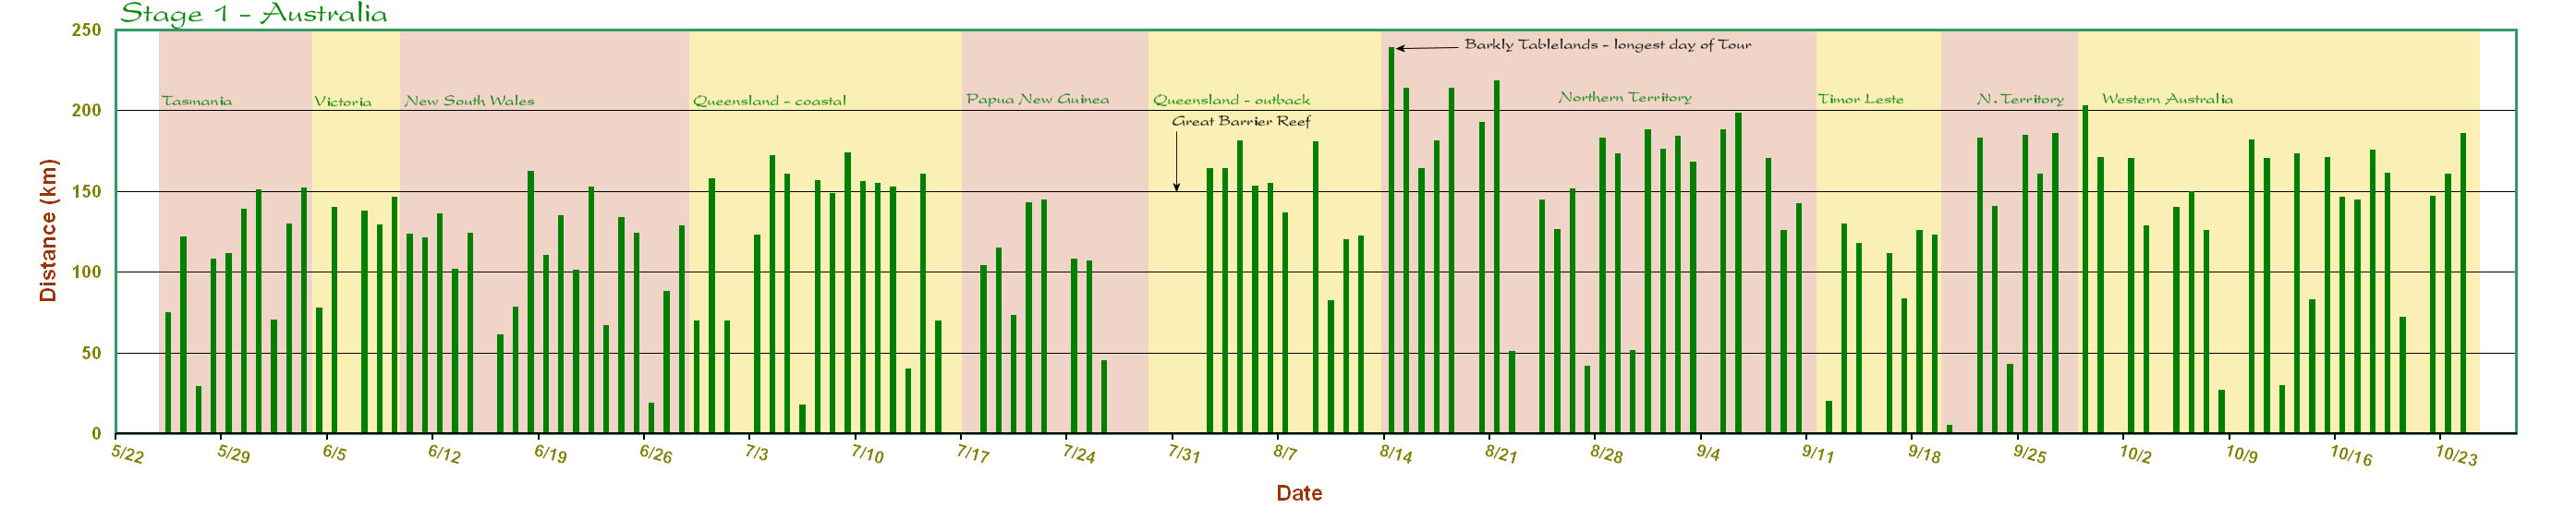
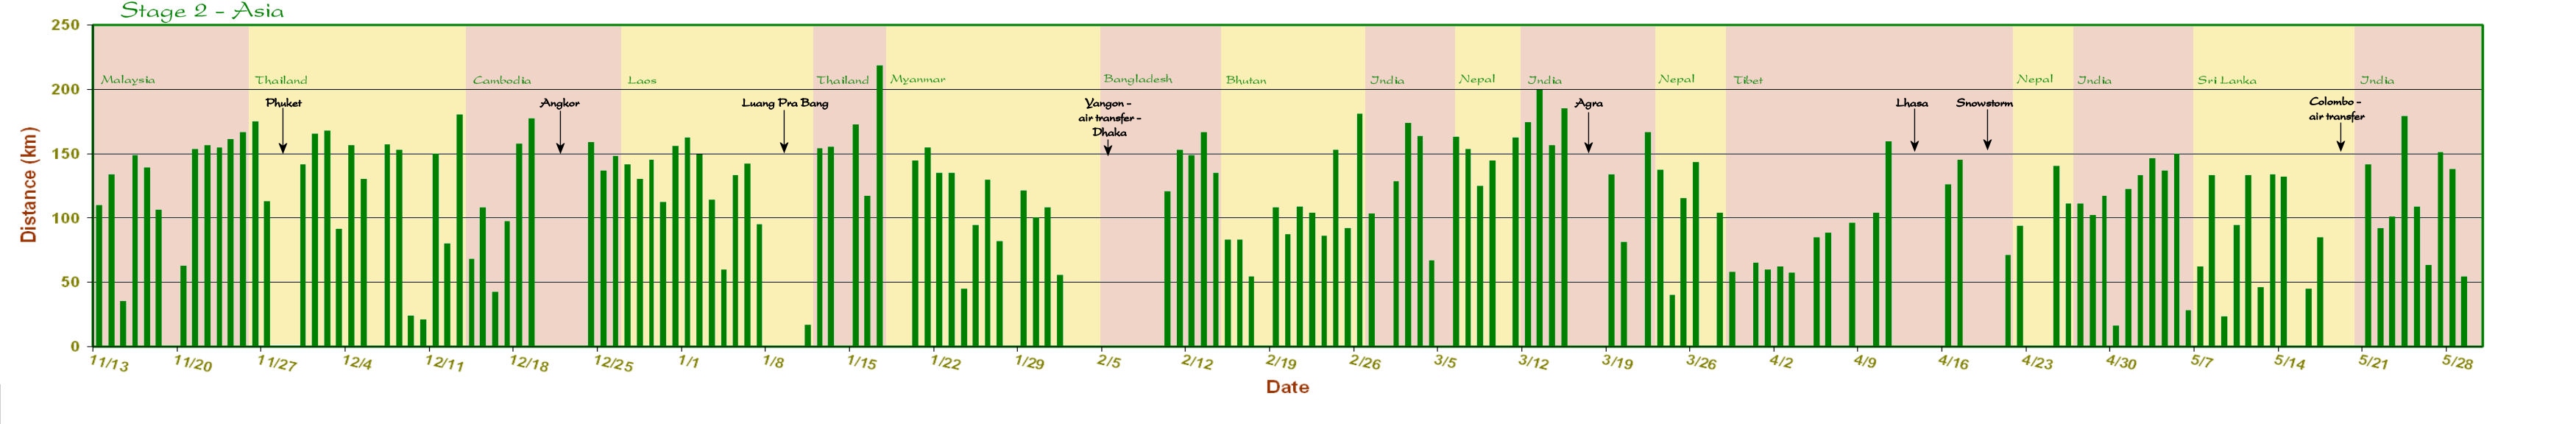
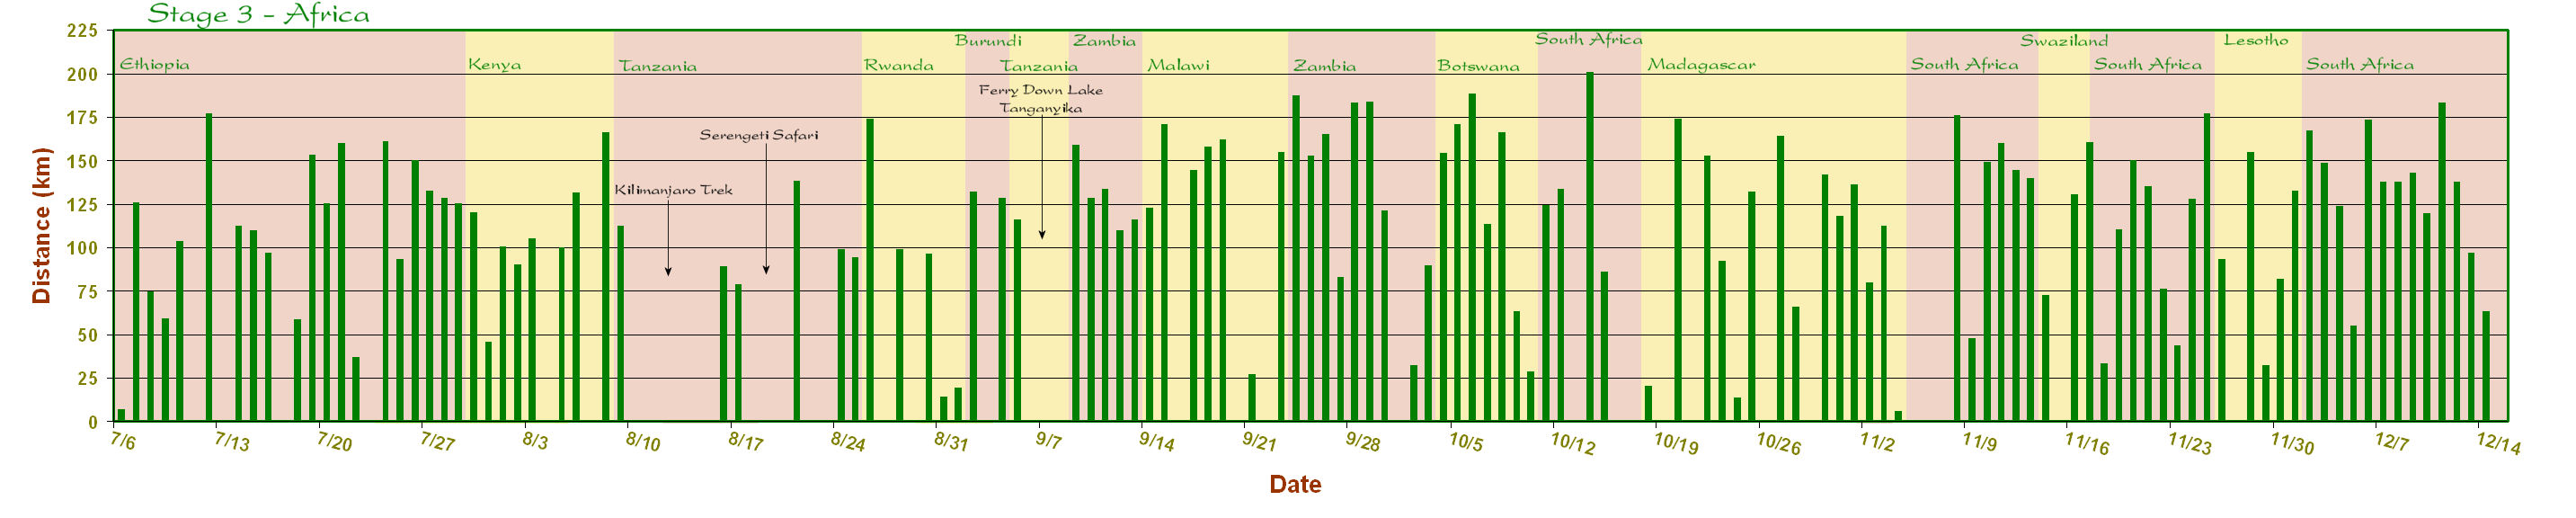
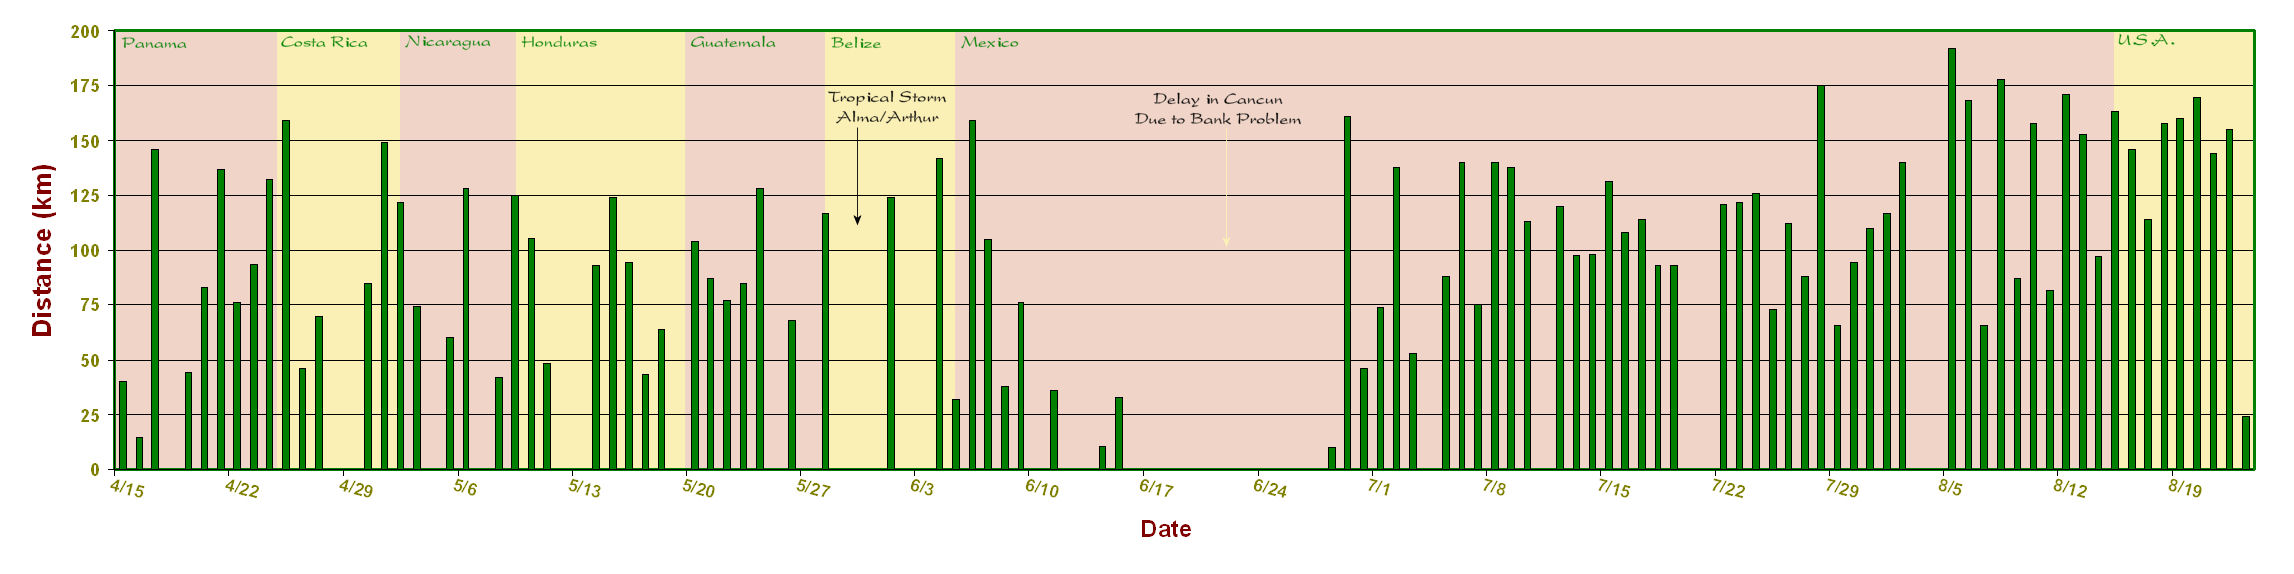
Daily Cycling Distance
These are simply the total distance ridden by bicycle for each day. What may be of mild interest, is seeing the drop in pace in the mountainous regions, and as I began to tire out towards the end of the Tour
Click a thumbnail to see the full graph.
Stage 1
Stage 2
Stage 3

Stage 4
Stage 5
Maximum Daily Elevation
These give Daily Maxima as measured by the altimeter function of my cyclocomputer. Scales vary with each Stage.
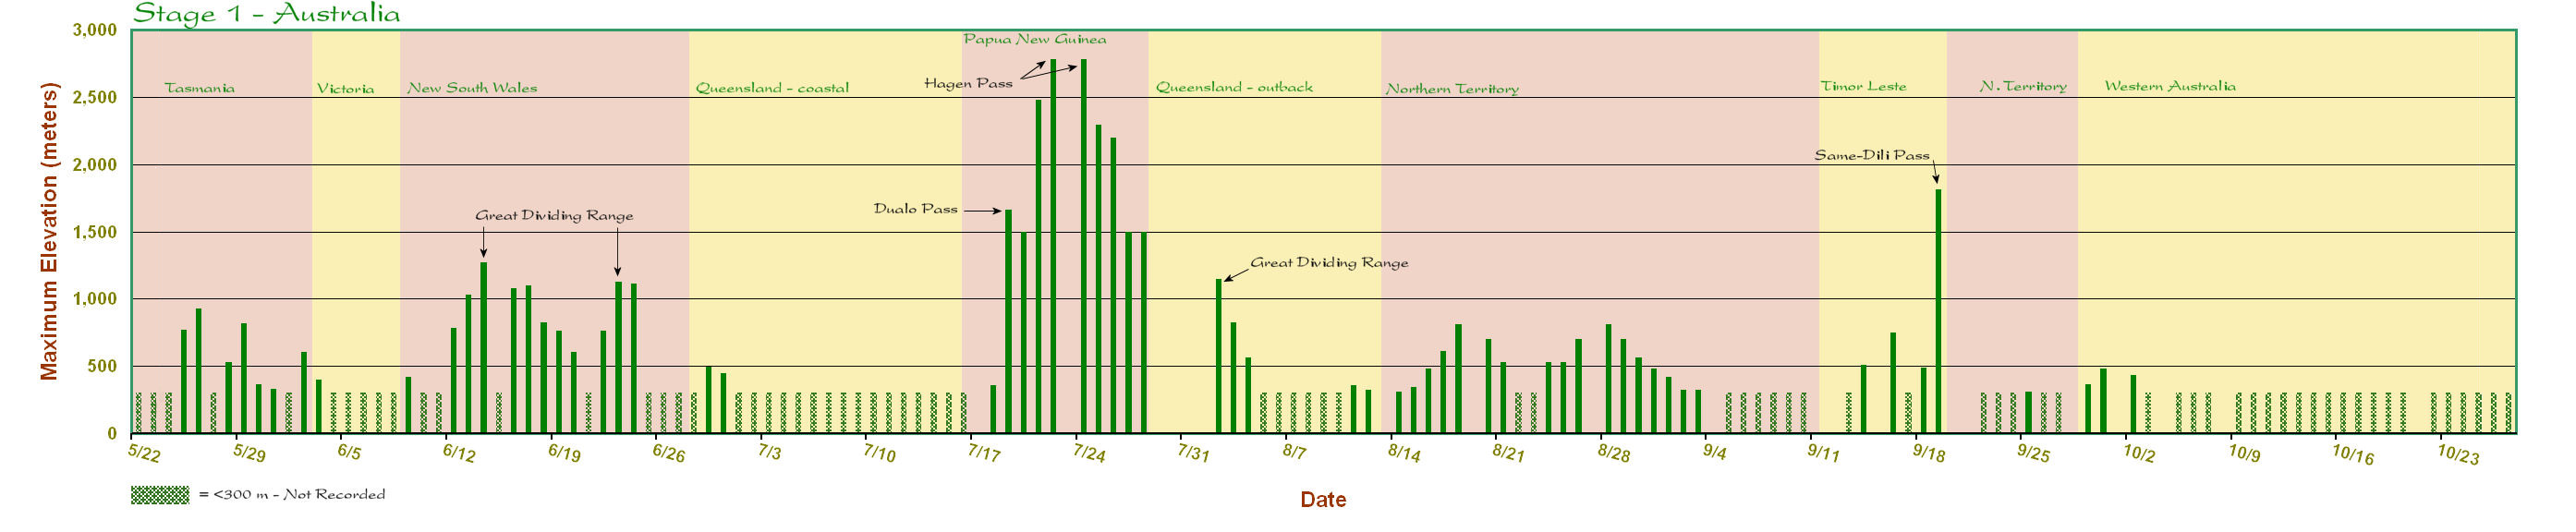
Stage 1
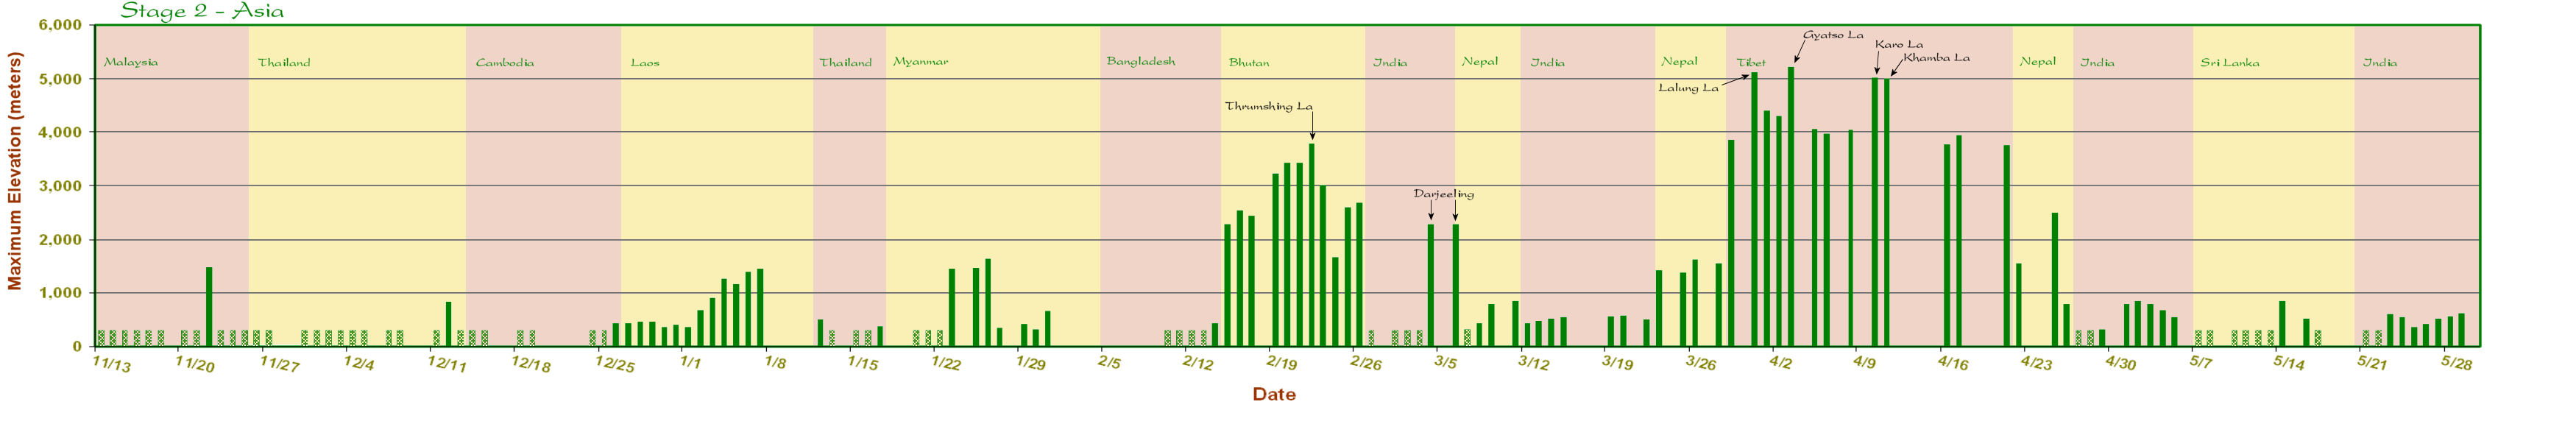
Stage 2
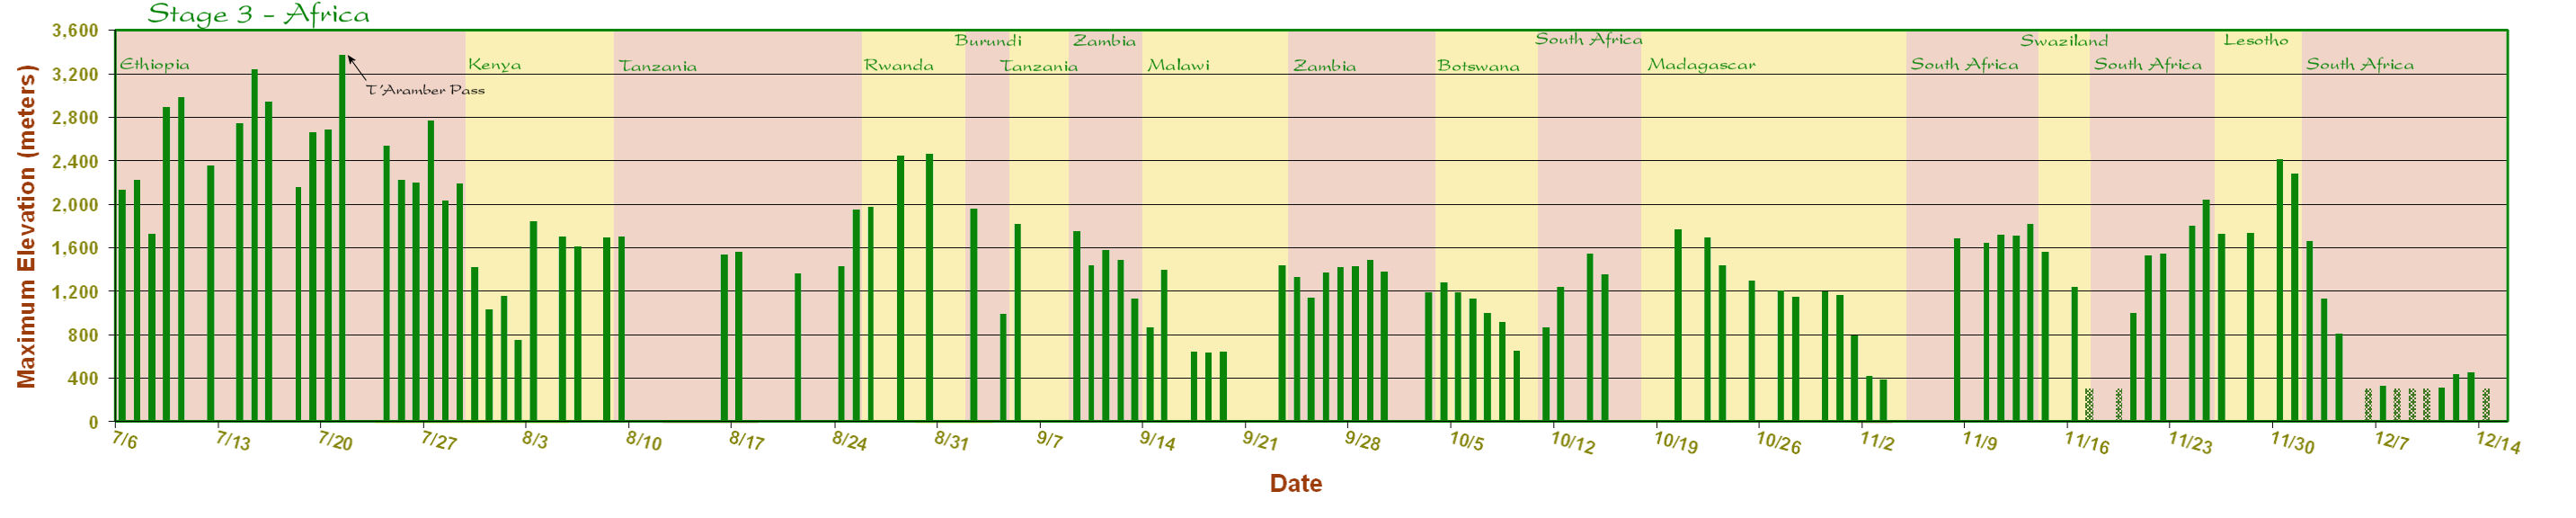
Stage 3

Stage 4
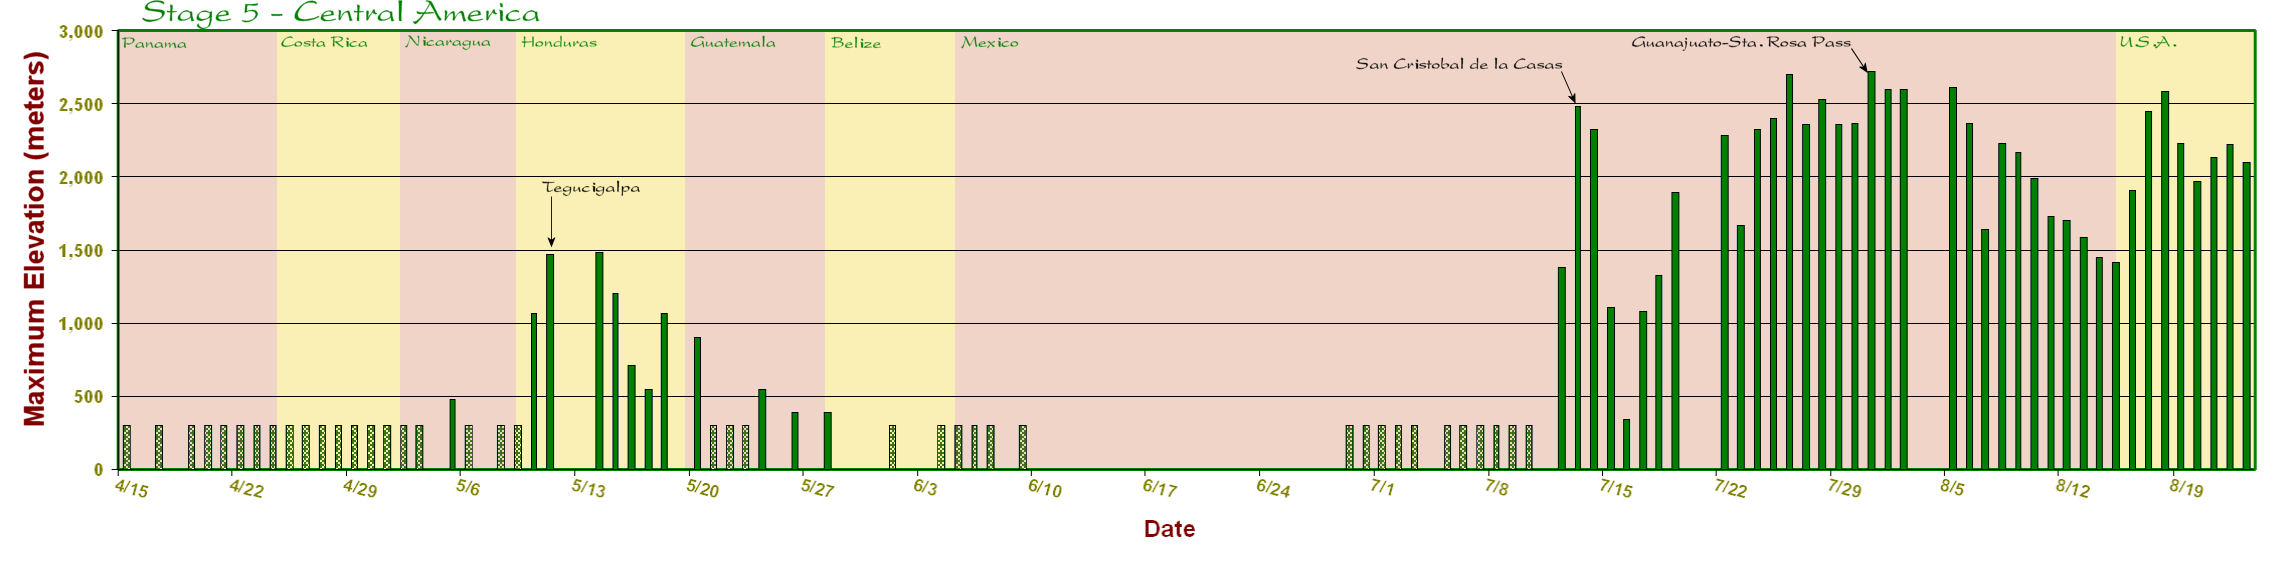
Stage 5
Maximum Daily Temperatue
These give Daily Maxima as best as I could determine.
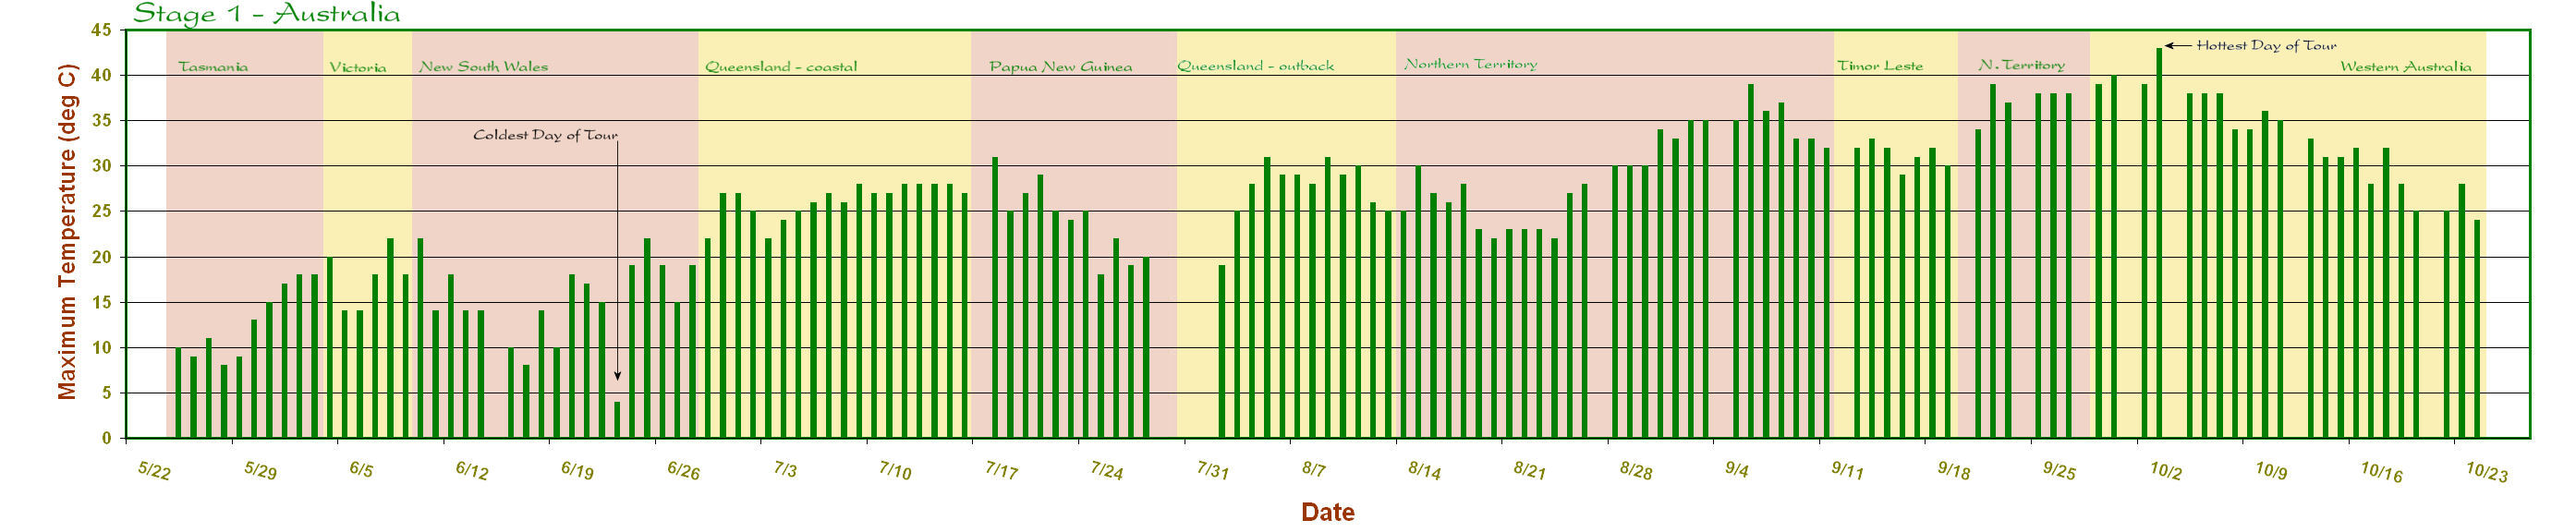
Stage 1
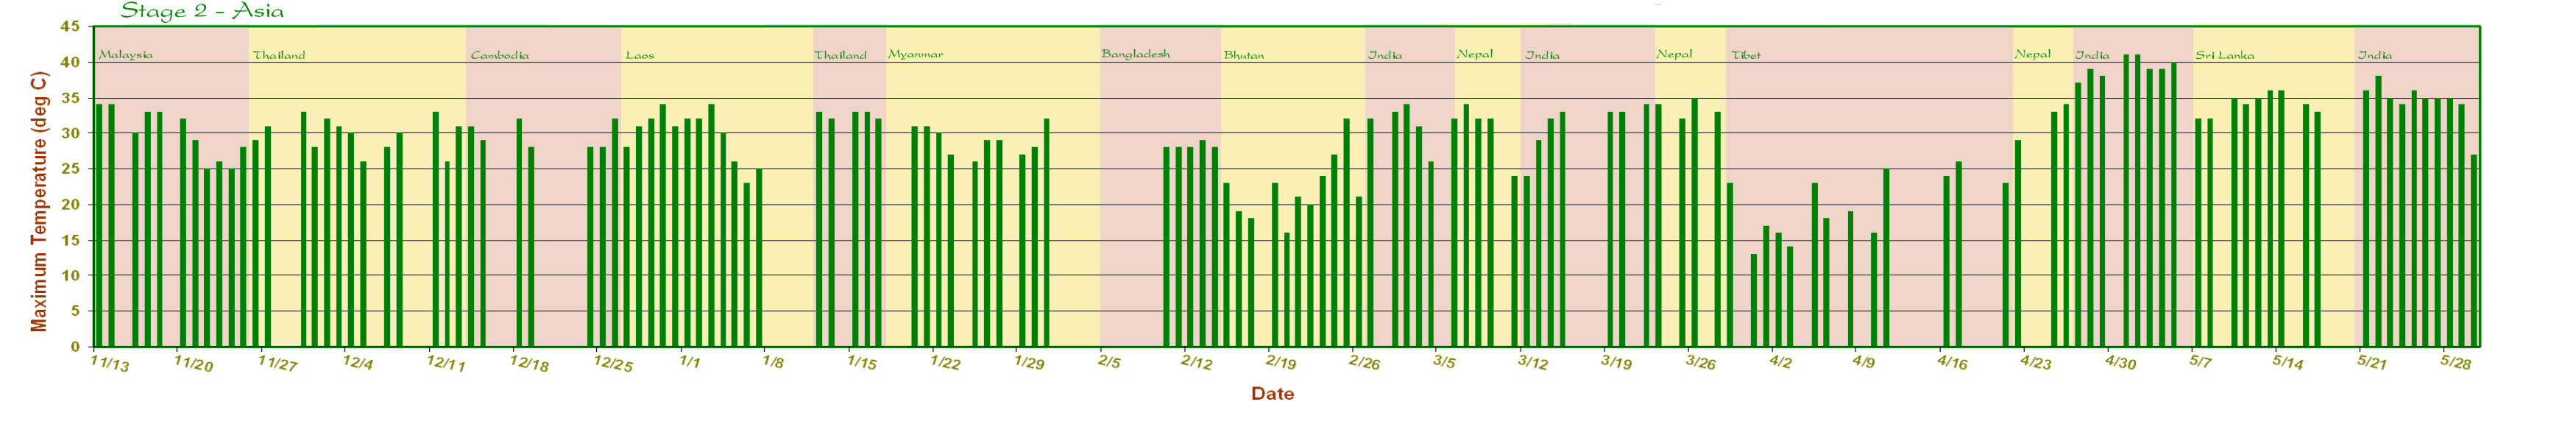
Stage 2
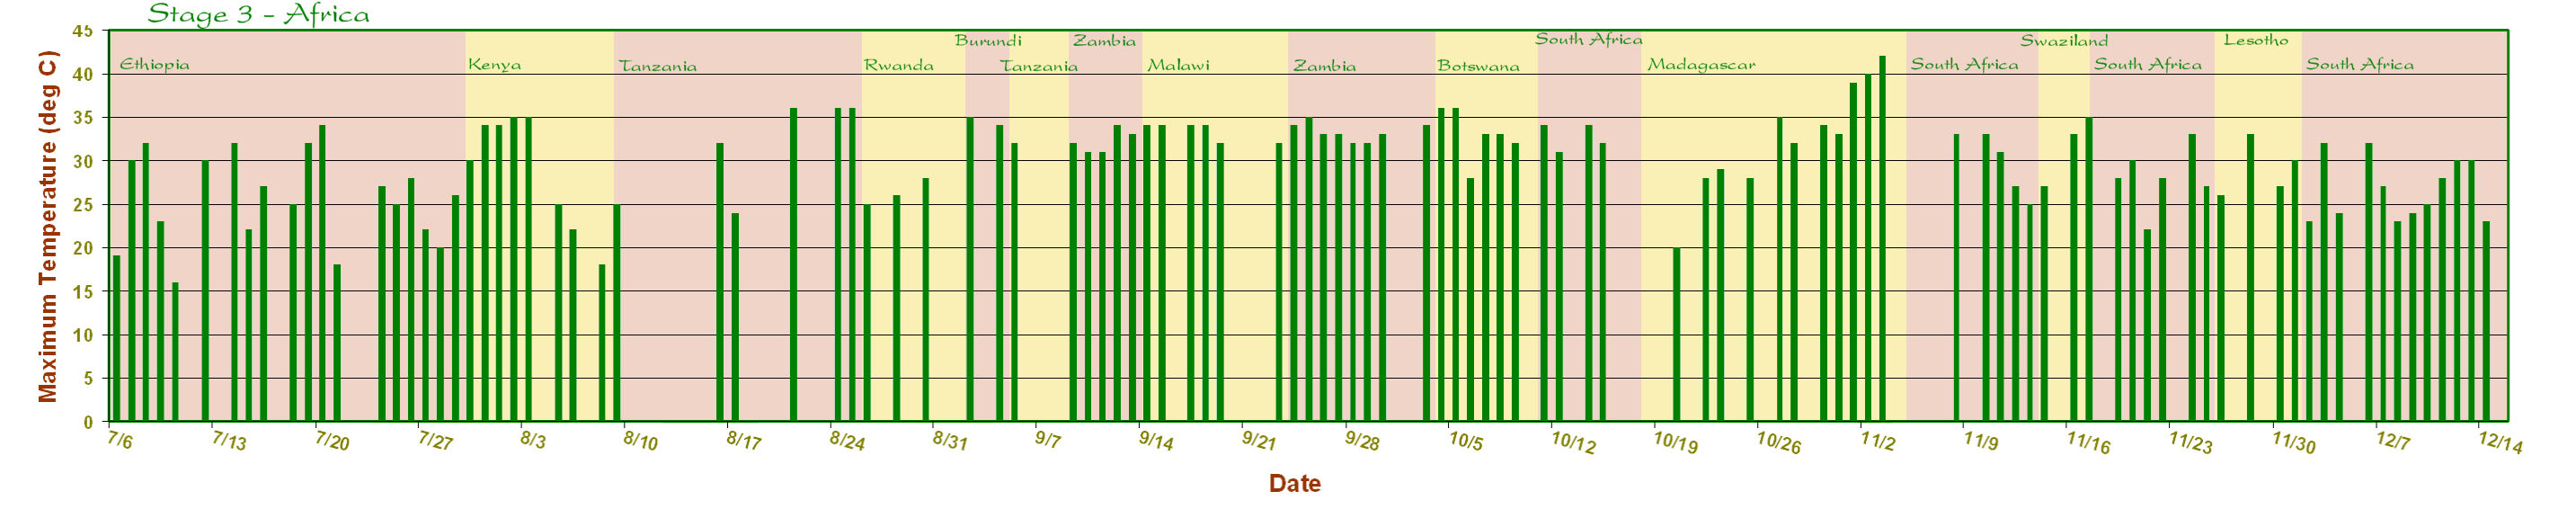
Stage 3

Stage 4
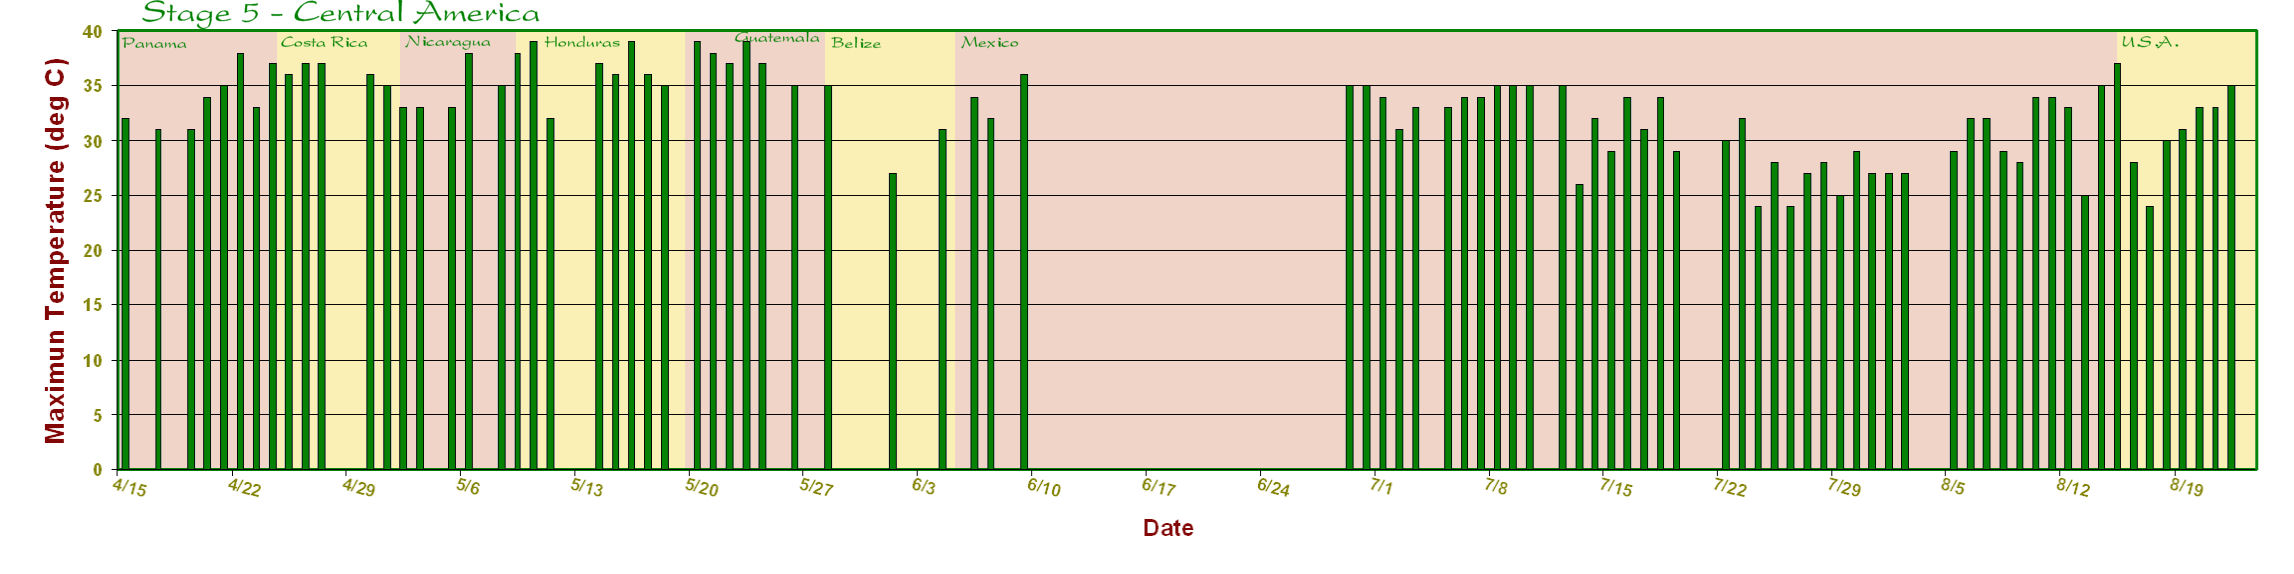
Stage 5
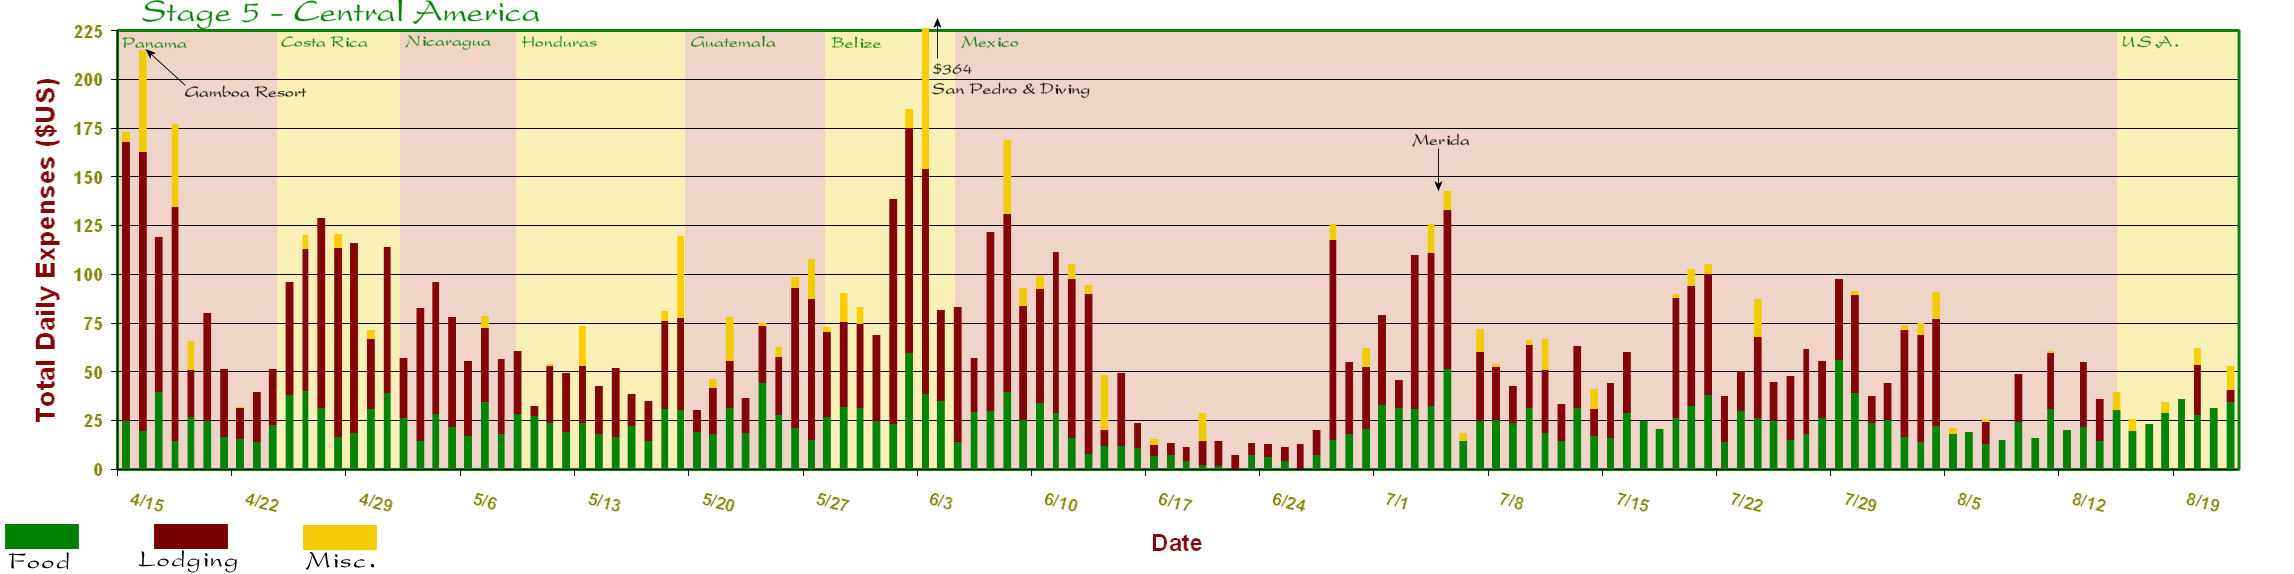
Daily Expenses
These give stacked charts for total daily expenses in three categories, Food, Accommodation, and Miscellaneous. The latter category contains just about everything besides food and lodging, including; local transport, entrance fees, guides, border taxes, supplies, laundry, haircuts, Internet, phone, and postal charges. Not included are Long distance transport, and major bike parts (specifically, those sent from home.) It should be noted that I have never been one to seek out the most bargain basement prices with any level of diligence while on tour, though I never complained when I found them by accident. This was more of an issue during Stages 4 and 5. Therefore, it could certainly be possible to travel at a somewhat lower cost than I did. Values have been converted to US Dollars using the exchange rate in place at the time of my visit.
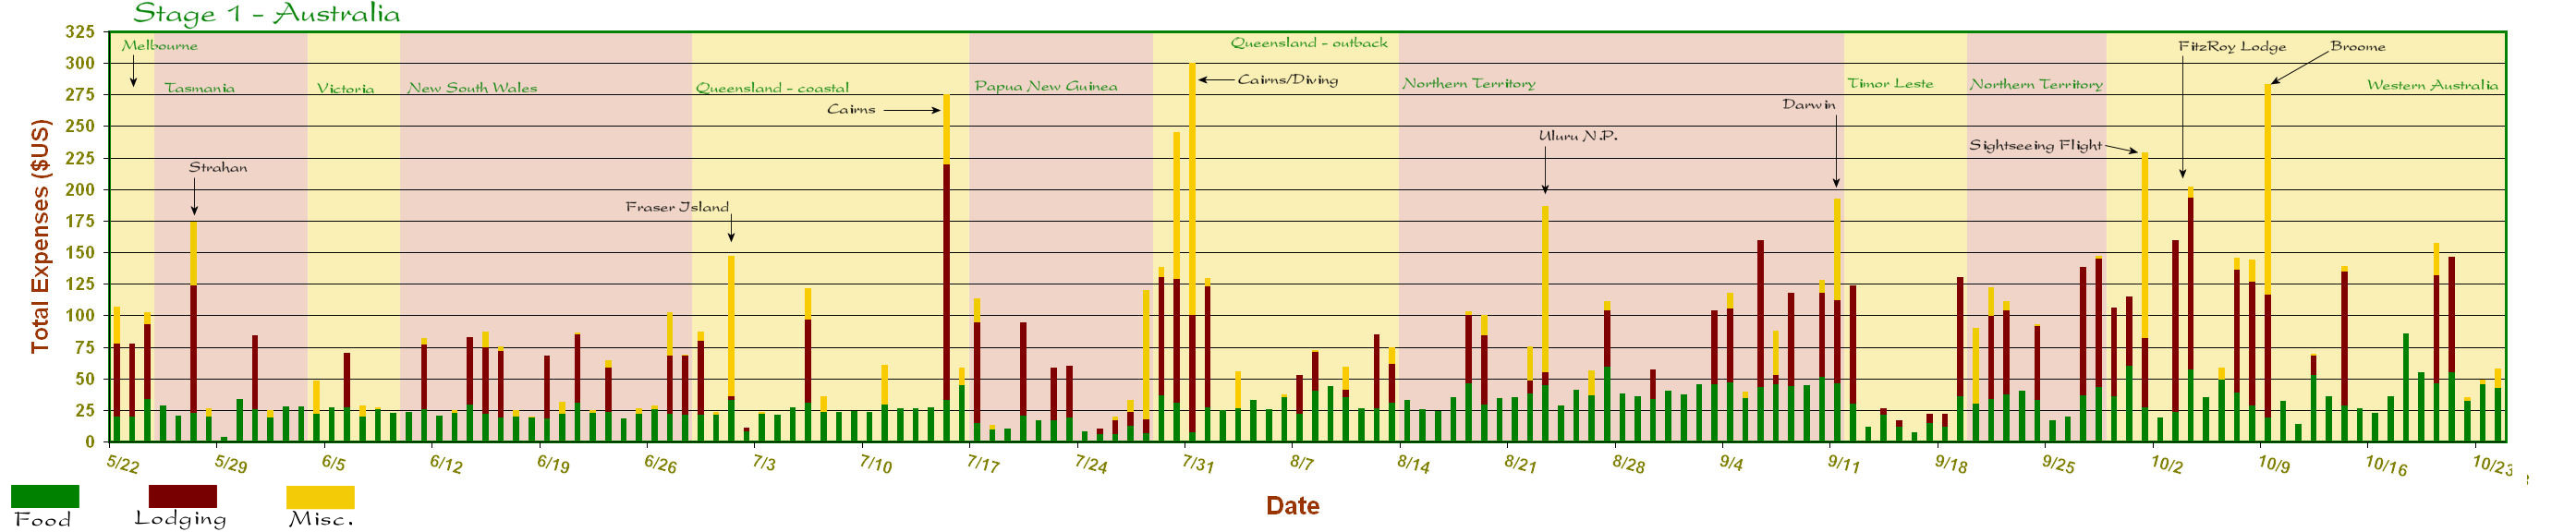
Stage 1
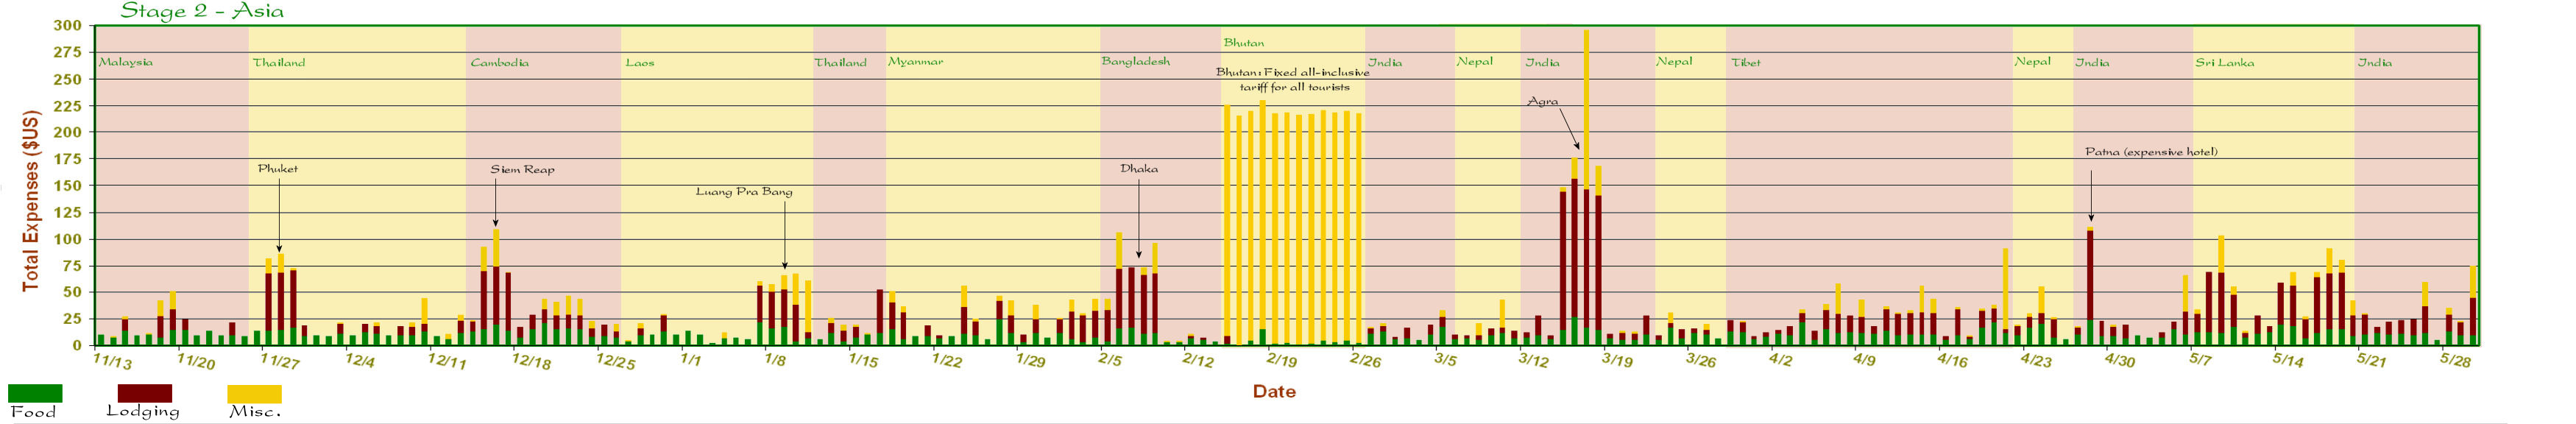
Stage 2
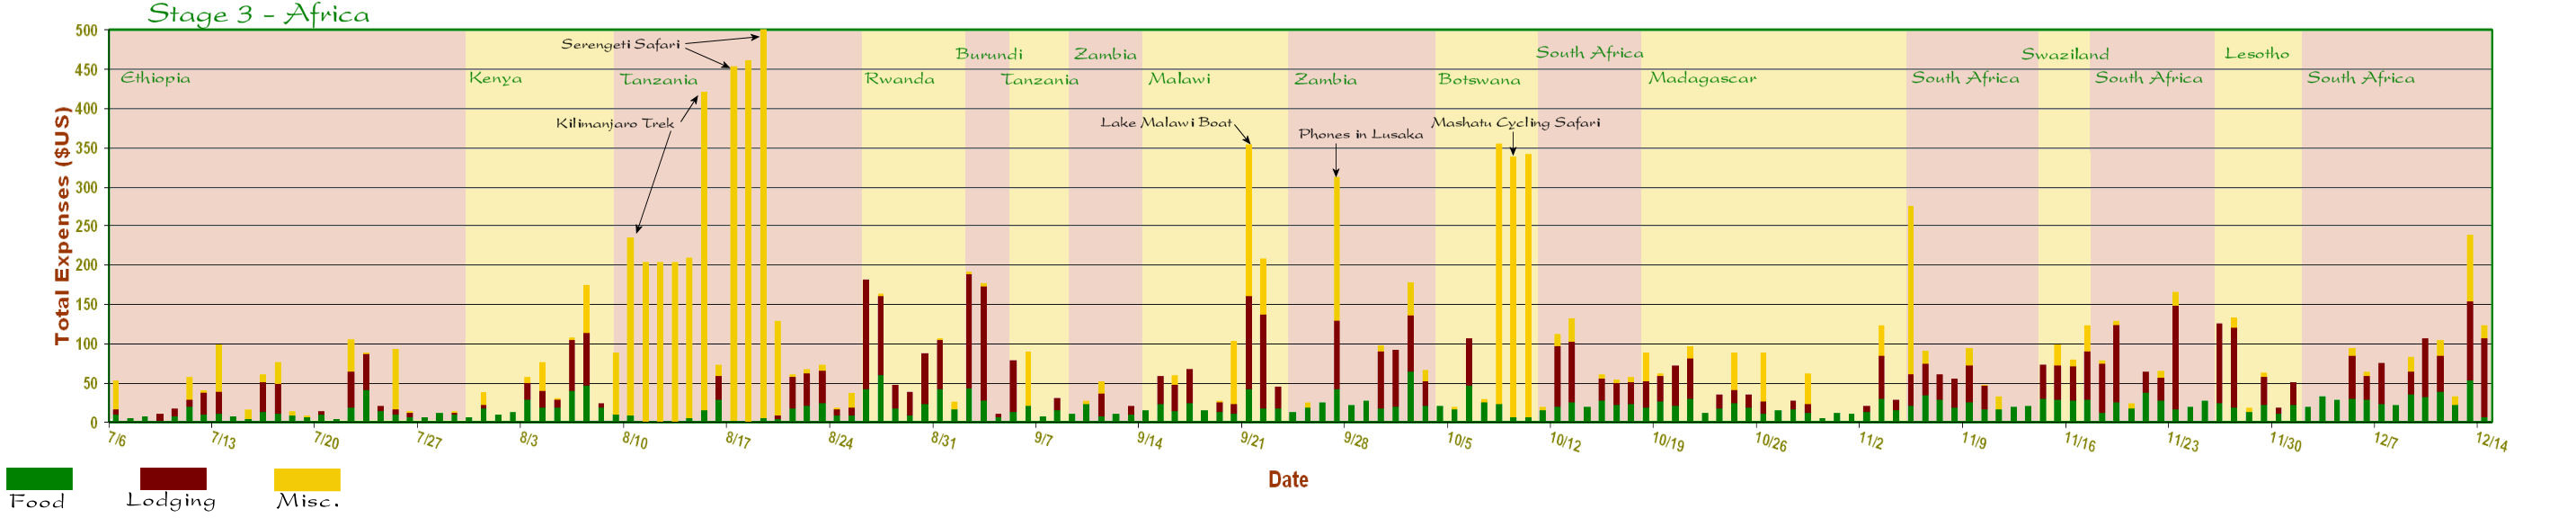
Stage 3

Stage 4
Stage 5
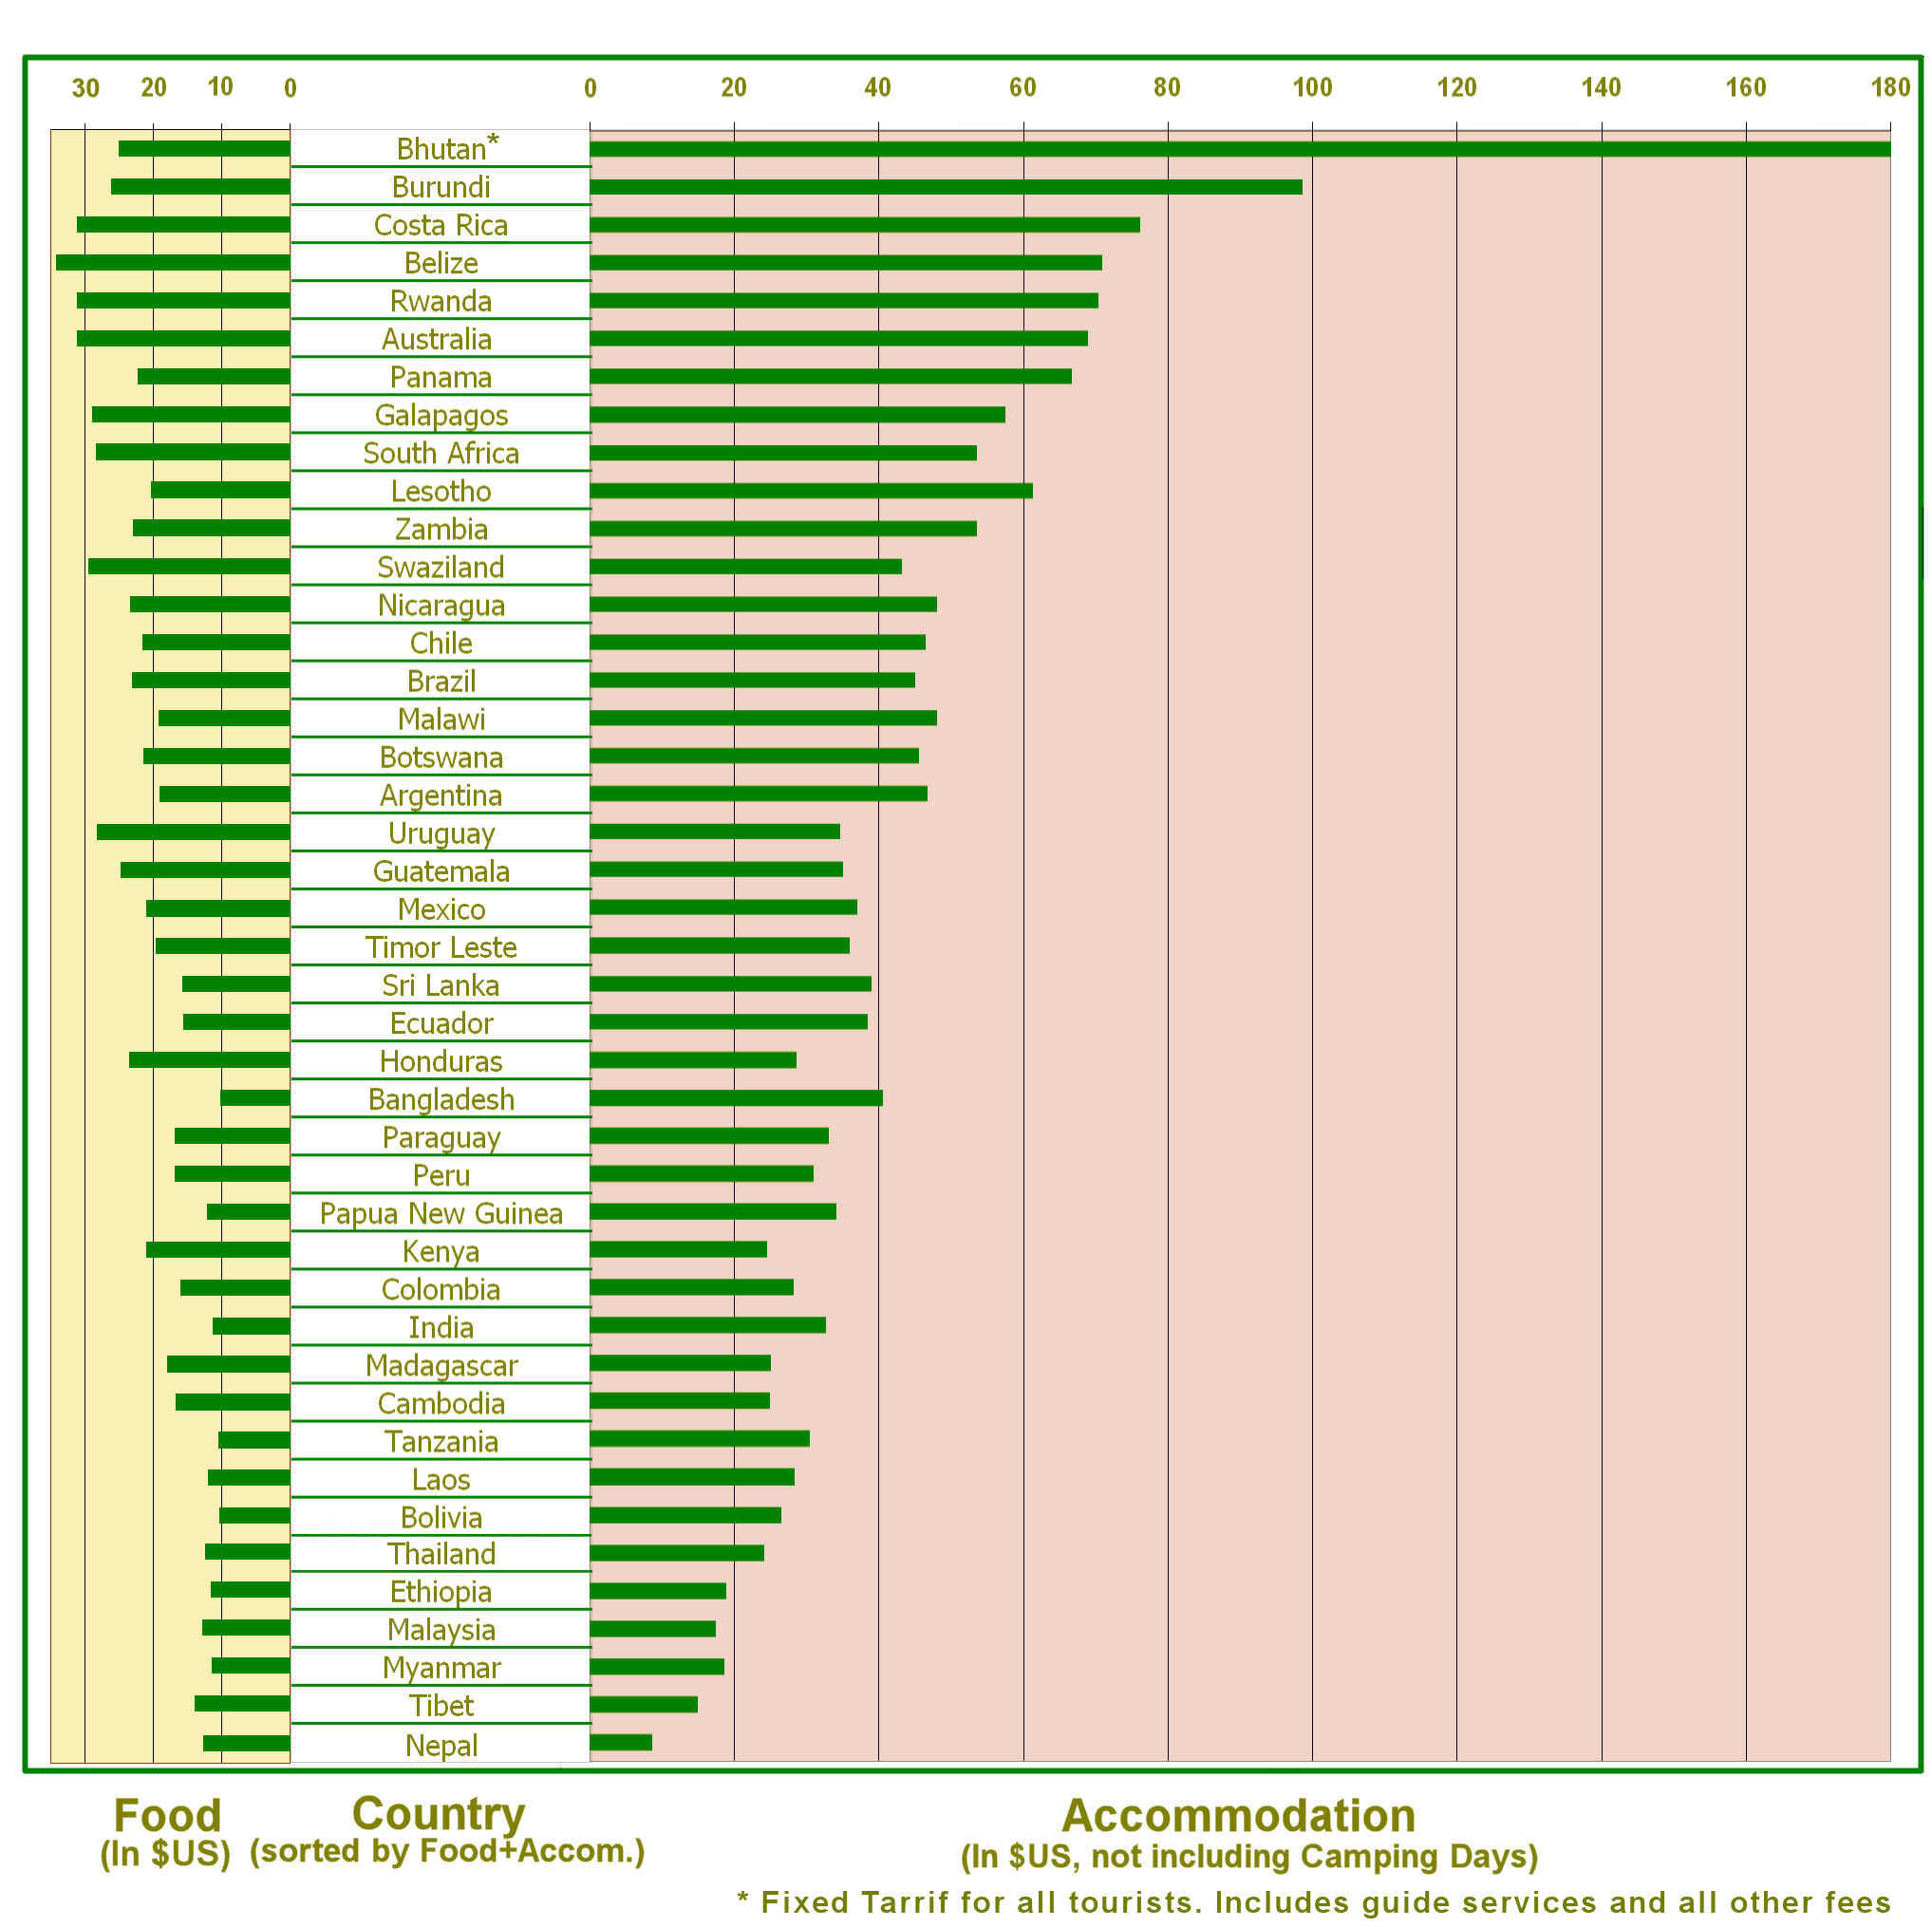
Countries Ranked by Expenses
This chart ranks the 44 cycling countries of the Tour according to my average daily expenses. Only food and lodging are included. Average accommodation values do not take into account camping days, unless there was a charge for that. Bhutan is notable anomaly, as there is a fixed tariff of $200/day ($165/day in the off-season, when I visited) for all tourists, which includes food, lodging, and guides. In general, small countries, such as Panama, or Burundi are skewed towards higher expenses, as one usually passes a higher proportion of the time while there in the relatively expensive capital cities. Values have been converted to US Dollars using the exchange rate in place at the time of my visit.
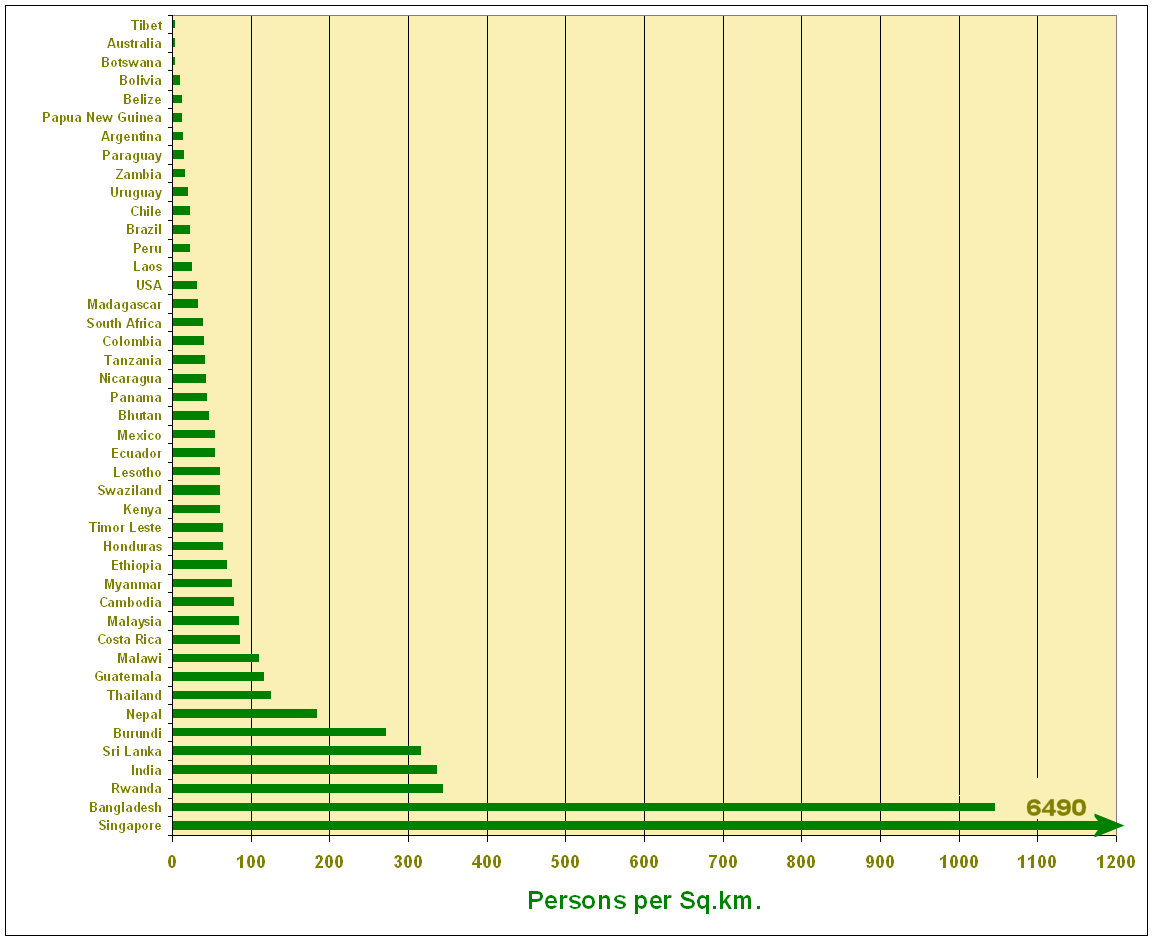
Countries Ranked by Population Density
This chart ranks the 44 cycling countries of the Tour according to population density. This quantity gives a surprisingly accurate impression of what the nature of a tour will be like in a specific place. For example, a density around 80 persons/sq. km, or above, typically means that a region is not well suited for free camping, in my opinion. Note that Singapore is off the scale at nearly 6,500 persons/sq. km. (Data from: Wikipedia)
Previous | Next
Main Index | Pre-Tour Index
Post-Tour Index | Articles Index
Main Index Pre-Tour Post-Tour Articles Previous Next |
Stage Performance
Here are charts showing the relative frequency of Full Days (6-10 hours of cycling); Half Days (3-5 hours); Partial Days (<40 km); and Rest Days, for each of the five Stages. There are nothing especially valuable about these data, except perhaps to observe how my ability to keep up my desired pace steadily eroded during the Tour. That was due to both my increasing lack of energy and by more frequent disruptions from outside factors in the latter Stages. Rest days appear abnormally low in Stage 1 because in Australia I frequently avoided spending two nights in costly hotels by camping just outside of the destination for the first night, and then riding in early the next morning, creating many more partial days. The increased number of half days in Stage 5 was due, in large part, to the sweltering heat through most of the route.
Stage 1
Stage 2
Stage 3
Stage 4
Stage 5